v1.78
November 19, 2026
A live 1D portfolio chart and balances that match everywhere
InvestmentsAccountsOnboarding
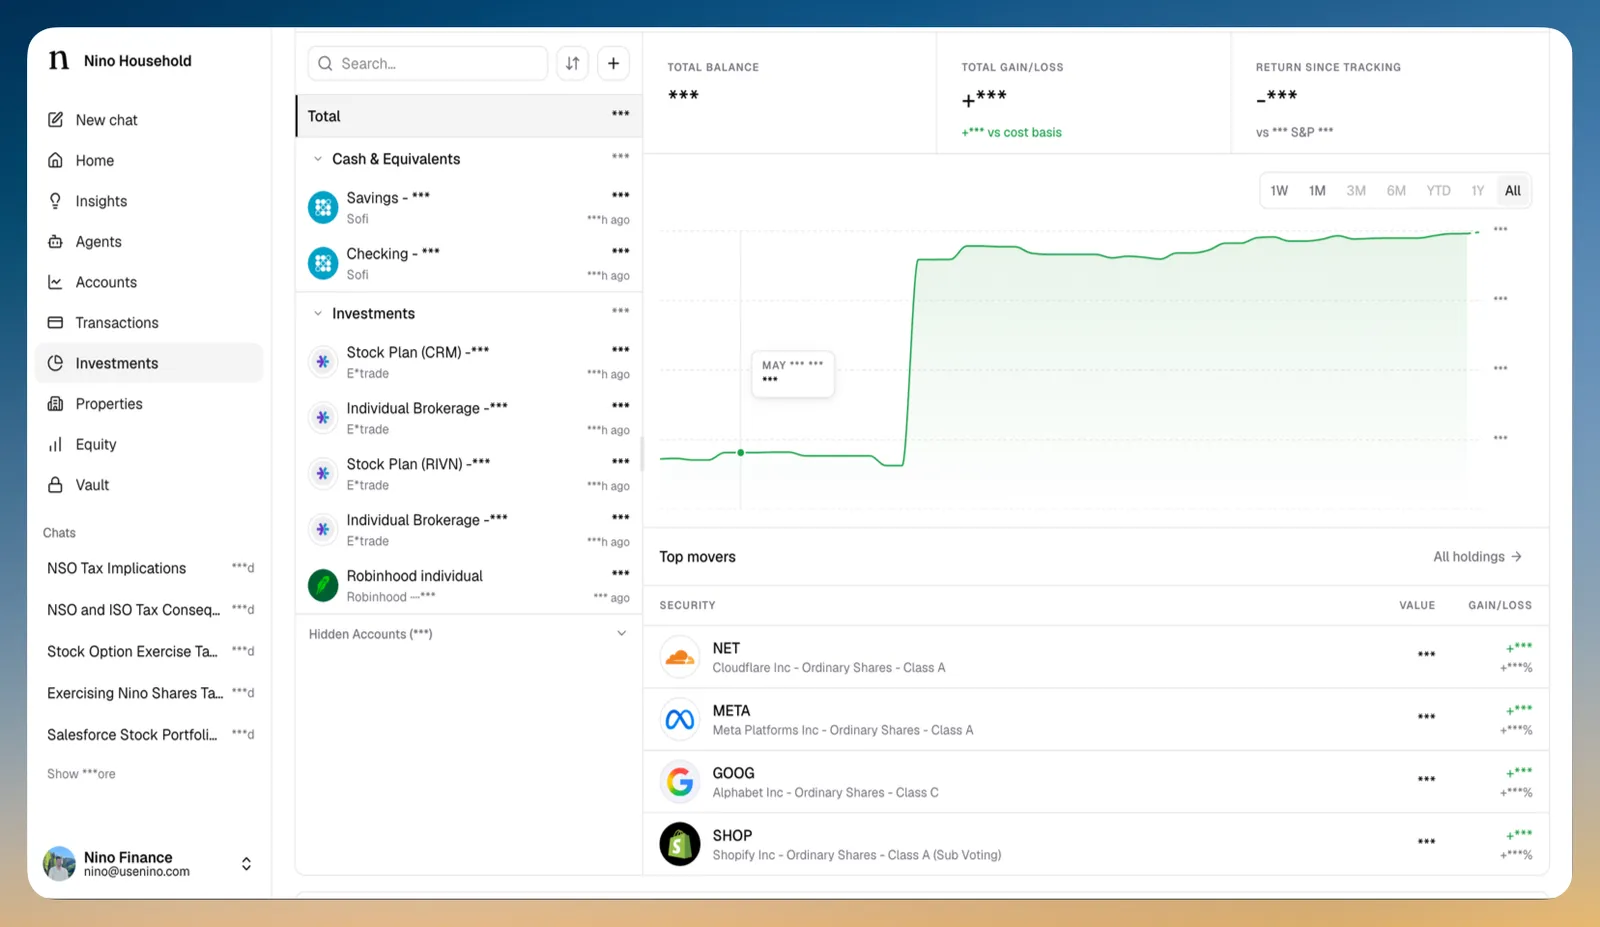
Investments now shows a live 1D chart built from 5-minute prices, including pre-market and after-hours, with live prices across the Overview and Market tab. Account balances, net worth and your portfolio now agree everywhere, and new web sign-ups start on the Free plan with an optional intro call.
Now you can
- A live 1D portfolio chart with pre-market and after-hours trading
- Live prices across Investments
- Balances and net worth that match your holdings everywhere
- The Investments 1D chart now plots your portfolio every 5 minutes, from pre-market through after-hours. A line marks where the day started, the chart shades green above it and red below, and the current market session is highlighted.
- Prices on the Investments Overview, holdings and the Market tab now update live while you have the page open.
- New web sign-ups now start on the Free plan with no trial or card. After you accept the terms, you can book an intro call with our team or skip it for now, and if you already booked a call on our site, you'll see it instead.
- Your accounts, net worth, the Investments overview and chat now show the same value for each investment account, priced with our latest market prices instead of your provider's day-old balance.
- When part of your portfolio value isn't in a holding, like uninvested cash or a balance-only account, a line under your holdings now says how much.
- The new Investments page is now the only one, for everyone.
- Turn on Include cash accounts at the bottom of the accounts filter to add your cash accounts to Investments.
- The Activity tab is now a compact table with time, type, asset, quantity, account and amount columns.
- Expanded holdings now show each account's logo.
- The projected dividends chart now shows your monthly average right on the chart.
- Switching an asset's price chart to 1D or 1W no longer flashes the 5Y chart first.
- Going back from an asset page now returns you to where you came from.